
SQS's Slow Tail Latency

· 11 min read
Hunter Fernandes
Software Engineer

At my company, we use AWS Simple Queue Service (SQS) for a lot of heavy lifting. We send ✨many✨ messages. I can say that it's into the millions per day. Because we call SQS so frequently and instrument everything, we get to see its varied performance under different conditions.

amazon simple queuing service logo

Backend Background

Our application backend is written in Python using Django and Gunicorn and uses the pre-fork model.1 This means that we always need to have a Gunicorn process available and waiting to pick up a connection when it comes in. If no Gunicorn process is available to receive the connection, it just sits and hangs. This means that we need to optimize on keeping Gunicorn processes free. One of the main ways to do this is to minimize the amount of work a process must perform in order to satisfy any single API request.

But that work still needs to be done, after all. So we have a bunch of separate workers waiting to receive tasks in the background. These background workers process work that takes a long time to complete. We offload all long work from our Gunicorn workers to our background workers. But how do you get the work from your frontend Guncicorn processes to your background worker pool?

The answer is by using a message queue. Your frontend writes ("produces") jobs to the message queue. The message queue saves it (so you don't lose work) and then manages the process of routing it to a background worker (the "consumers"). The message queue we use is SQS. We use the wonderful celery project to manage the producer/consumer interface. But the performance characteristics all come from SQS.

To recap, if a Gunicorn API process needs to do any non-negligible amount of work when handling a web request, it will create a task to run in the background and send it to SQS through the sqs:SendMessage AWS API. The net effect is that the long work has been moved off the critical path and into the background. The only work remaining on the critical path is the act of sending the task to the message queue.

So as long as you keep the task-send times low, everything is great. The problem is that sometimes the task-send times are high. You pay the price for this on the critical path.

Latency at the Tail

We care a lot about our API response time: high response times lead to worse user experiences. Nobody wants to click a button in an app and get three seconds of spinners before anything happens. That sucks. It's bad U/X.

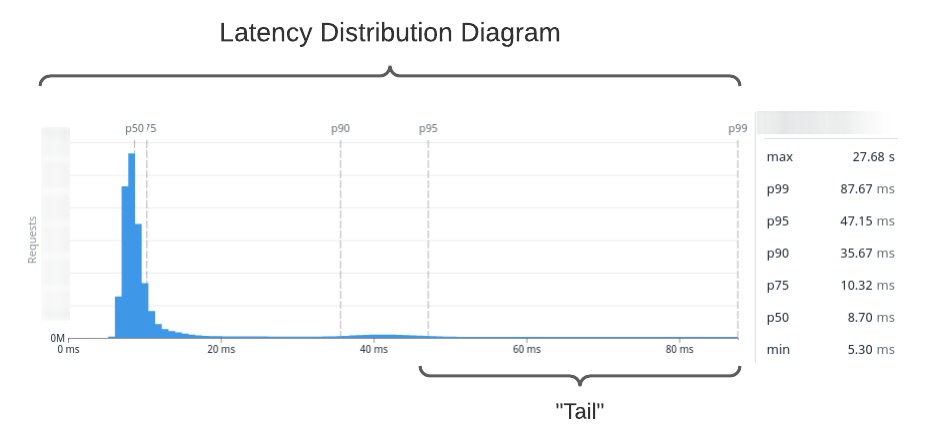
One of the most valuable measures of performance in the real world is tail latency. You might think of it as how your app has performed in the worst cases. You line up all your response times (fastest-to-slowest) and look at the worst offenders. This is very hard to visualize, so we apply one more transformation: we make a histogram. We make response time buckets and count each response time in the bucket. Now we've formed a latency distribution diagram.

Quick note for the uninitiated: pX are percentiles. Roughly, this means that pX is the Xth slowest time out of 100 samples. For example, p95 is the 95th slowest. It scales, too: p99.99 is the 9,999th slowest out of 10,000 samples. If you're more in the world of statistics, you'll often see it written with subscript such as p95.

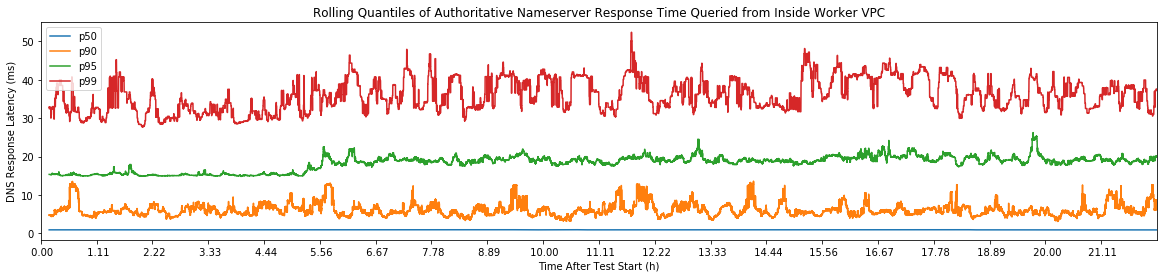
You can use your latency distribution diagram to understand at a glance how your application performs. Here's our sqs:SendMessage latency distribution sampled over the past month. I've labeled the high-end of the distribution, which we call the tail.

example latency distribution

What's in the tail?

We have a backend-wide meeting twice a month where we go over each endpoint's performance. We generally aim for responses in less than 100 milliseconds. Some APIs are inherently more expensive, they will take longer, and that's ok. But the general target is 100ms.

One of the most useful tools for figuring out what's going on during a request is (distributed) tracing! You may have heard of this under an older and more vague name: "application performance monitoring" (APM). Our vendor of choice for this is Datadog, who provides an excellent tracing product.

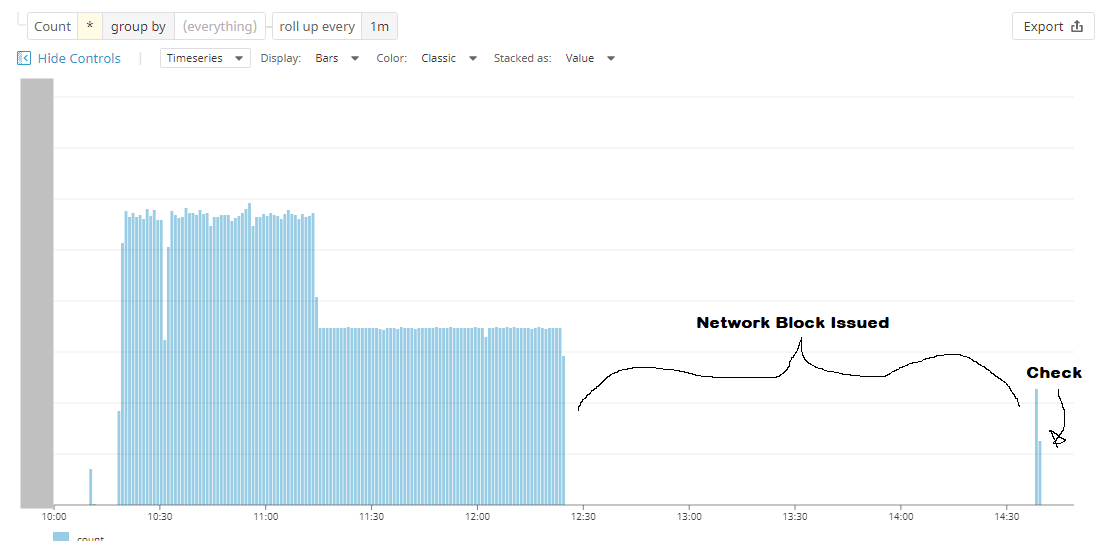
For the last several performance meetings, we've had the same problem crop up. We look at the slowest 1-3% of calls for a given API endpoint and they always look the same. Here's a representative sample:

SQS is very slow.

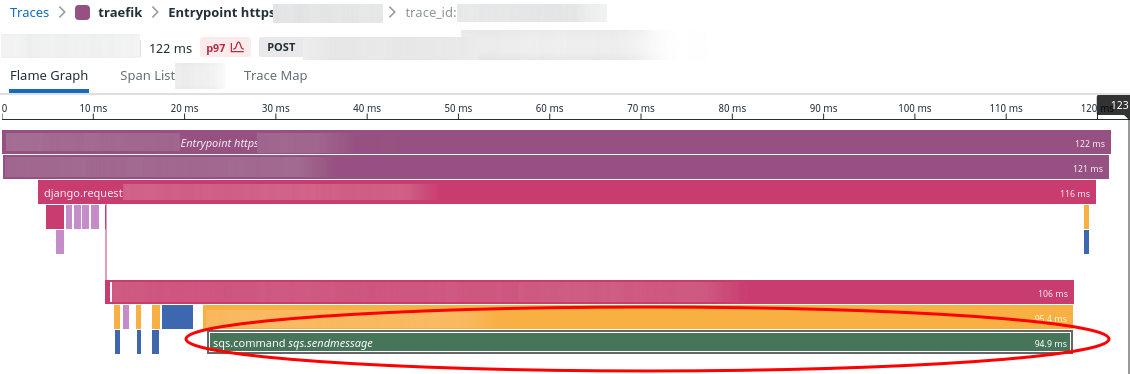
See the big green bar at the bottom? That is all sqs:SendMessage. Of the request's 122ms response time, 95ms or 75% of the total time was waiting for SQS:SendMessage. This specific sample was the p97 for this API endpoint.

There are two insights we get from this trace:

  1. To improve the performance of this endpoint, we need to focus on SQS. Nothing else really matters.

  2. High tail latency for any of our service dependencies are going to directly drive our API performance at the tail. Of course, this makes total sense. But it's good to acknowledge it explicitly! It's futile to try to squeeze better performance out of your own service if a dependency has poor tail latency.

    The only way to improve the tail latency is to either drop the poor performer or to change the semantics of your endpoint. A third option is to attempt to alleviate the tail latencies for your service dependency if you can do so. You can do this if you own the service! But sometimes, all you have is a black box owned by a third party (like SQS).

Strategies to Alleviate Dependent Tail Latency

Dropping the Service

Well, we can't drop SQS at this time. We'll evaluate alternatives some time in the future. But for now, we're married to SQS.

Changing API Semantics

An example of changing API semantics: instead of performing the blocking SendMessage operation on the main API handler thread, you might spin the call out to its own dedicated thread. Then, you might check on the send status before the API request finishes.

The semantic "twist" happens when you consider what happens in the case of a 5, 10, or even 20 second SendMessage call time. What does the API thread do when it's done handling the API request but the SendMessage operation still hasn't yet been completed? Do you just... skip waiting for the send to complete and move on? If so, your semantics have changed: you can no longer guarantee that you durably saved the task. Your task may never get run because it never got sent.

For some exceedingly rare endpoints, that's acceptable behavior. For most, it's not.

There is yet another point hidden in my example. Instead of just not caring whether the task was sent, say instead we block the API response until the task send completes (off thread). Basically, we get the amount of time we spend doing other non-SQS things shaved off of the SQS time. But we still have to pay for everything over the other useful time. In this case, we've only improved perhaps the p80-p95 of our endpoint. But the worst-case p95+ will still stay the same! If our goal in making that change was to reduce the p95+ latency then we would have failed.

Alleviating Service Dependency Tail Latency

SQS has a few knobs we can turn to see if they help with latency. Really, these knobs are other SQS features, but perhaps we can find some correlation to what causes latency spikes and work around them. Furthermore, we can use our knowledge of the transport stack to make a few educated guesses.

Since SQS is a black box to us, this is very much spooky action at a distance.

SQS Latency Theories

So why is SQS slow? Who knows? Well, I guess the AWS team but they aren't telling.

I've tested several hypotheses and none of them give a solid answer for why we sometimes see 5+ second calls.

I've documented my testing here for other folks on the internet with the same issue. I've looked at:

  1. Cold-start connections
  2. Increasing HTTP Keep-Alive times
  3. Queue encryption key fetching
  4. SQS rebalancing at inflection points

Cold-start connections

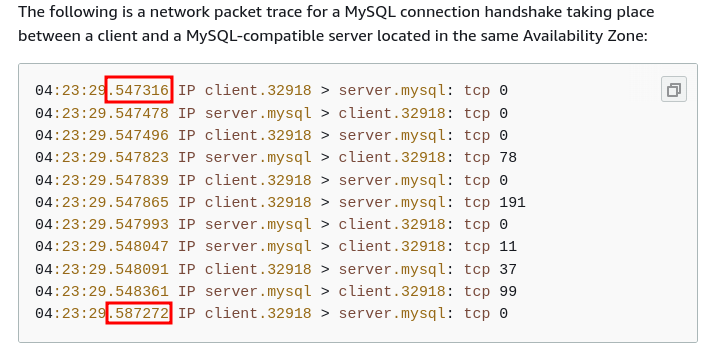
How about initiating new connections to the SQS service before keep-alive kicks in on boto3. If our process has never talked to SQS before, it stands to reason that there is some initial cost in establishing a connection to it in terms of TCP setup, TLS handshaking, and perhaps some IAM controls on AWS' side.

To test this, we ran a test that cold-started an SQS connection, sent the first message, and then sent several messages afterwards when keep-alive was active. Indeed, we found that the p95 of the first SendMessage was 87ms and the p95 of the following 19 calls was 6ms.

It sure seems like cold-starts are the issue. Keep-alive should fix this issue.

A confounding variable is that sometimes we see slow SendMessage calls even in the next 20 operations following an initial message. If the slow call was just the first call, we could probably work around it. But it's not just the first one.

Increasing Keep-Alive Times

In boto, you can set the maximum amount of time that urllib will keep a connection around without closing it. It should really only affect idle connections, however.

We cranked this up to 1 hour and there was no effect on send times.

Queue Encryption Key Fetching

Our queues are encrypted with AWS KMS keys. Perhaps this adds jitter?

Our testing found KMS queue encryption does not have an effect on SendMessage calls. It did not matter if the data key reuse period was 1 minute or 12 hours.

Enabling encryption increased the p95 of SendMessage by 6ms. From 12ms without encryption to 18ms with encryption. That's pretty far away from the magic number of 100ms we are looking for.

SQS Rebalancing at Inflection Points

Perhaps some infrastructure process happening behind the scenes when we scale up/down and send more (or fewer) messages throughout the day. If so, we might see performance degradation when we are transitioning along the edges of the scaling step function. Perhaps SQS is rebalancing partitions in the background.

If this were to be the case, then we would see high latency spikes sporadically during certain periods throughout the day. We'd see slow calls happen in bursts. I could not find any evidence of this from our metrics.

Instead, the slow calls are spread out throughout the day. No spikes.

So it's probably not scaling inflection points.

AWS Support

After testing all of these theories and not getting decent results, we asked AWS Support what the expected SendMessage latency is. They responded:

[The t]ypical latencies for SendMessage, ReceiveMessage, and DeleteMessage API requests are in the tens or low hundreds of milliseconds.

What we consider slow, they consider acceptable by design.

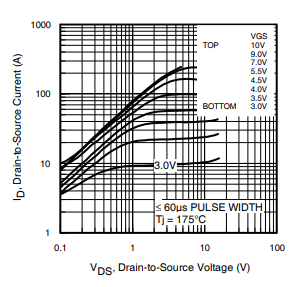
Here's an output characteristic curve from IRLB8721PbF MOSFET (pdf).

Hardware has such nice spec sheets.

Frankly, I consider this answer kind of a cop-out from AWS. For being a critical service to many projects, the published performance numbers are too vague. I had a brief foray into hardware last year. One of the best aspects of the hardware space is that every component has a very detailed spec sheet. You get characteristic curves for all kinds of conditions. In software, it's just a crapshoot. Services aiming to underpin your own service should be publishing spec sheets.

Normally, finding out the designed performance characteristics are suboptimal would be the end of the road. We'd start looking at other message queues. But we are tied to SQS right now. We know that the p90 for SendMessage is 40ms so we know latencies lower than 100ms are possible.

What Now?

We don't have a great solution to increase SQS performance. Our best lead is cold-start connection times. But we have tweaked all the configuration that is available to us and we still do not see improved tail latency.

If we want to improve our endpoint tail latency, we'll probably have to replace SQS with another message queue.

Footnotes

  1. There are many problems with the pre-fork model. For example: accept4() thundering herd. See Rachel Kroll's fantastic (and opinionated) post about it. Currently, operational simplicity outweighs the downsides for us.

Athena 2 Cloudtrail "HIVE_BAD_DATA: Line too long"

· 3 min read
Hunter Fernandes
Software Engineer

Amazon recently announced the general availability of Athena 2, which contains a bunch of performance improvements and features.

As part of our release process, we query all of our Cloudtrail logs to ensure that no secrets were modified unexpectedly. But Cloudtrail has hundreds of thousands of tiny JSON files, and querying them with Athena takes forever. This is because under the hood Athena has to fetch each file from S3. This takes 20-30 minutes to run, and hurts the developer experience.

Worse than taking forever, it frequently throws an error of Query exhausted resources at this scale factor. The documentation suggests this is because our query uses more resources than planned. While you can typically get this error to go away if you run the same query a few more times, you only encounter the error after 15 minutes. It's a huge waste of time.

To fix this, every night we combine all tiny Cloudtrail files into a single large file. This file is about 900 MB of raw data but compresses down to only 60 MB. We instead build our Athena schema over these compressed daily Cloudtrail files and query them instead. This reduces the query time to only 3-4 minutes or so.

This worked great on Athena 1. But on Athena 2, we started seeing errors like this:

Your query has the following error(s):
HIVE_BAD_DATA: Line too long in text file: s3://xxx/rollup/dt=20190622/data.json.gz
This query ran against the "default" database, unless qualified by the query.
Please post the error message on our forum or contact customer support with Query Id: aaa8d916-xxxx-yyyy-zzzz-000000000000.

Contrary to the error message, none of the lines in the file are too long. They are at most about 2kb. There seems to be a bug in the AWS-provided Cloudtrail parser that treats the whole file as a single line which violates some hidden cap on line-length.

Some sleuthing of the Presto source code (which Athena is based on) shows that there is a default line length of 100 MB. Now, we split the consolidated Cloudtrail log into 100 MB chunks and query those instead.

This works out fine. But it's a pain and a waste of time to do this.

Athena has a cap on the total number of partitions you can have in a table. We used to consume only one partition per day, but this change ups it to 9 per day (and growing with data growth). Since the cap is 20,000, we're still well within quota.

I'm hoping that AWS will fix this bug soon. Everything about it is needlessly annoying.

MySQL Proxies

· 5 min read
Hunter Fernandes
Software Engineer

Our Django application connects to MySQL to store all of its data. This is a pretty typical setup. However, you may not know that establishing connections to MySQL is rather expensive.

MySQL Connections

I have written previously about controlling API response times -- we take it very seriously! One thing that blows up response latencies at higher percentiles is when our application has to establish a new MySQL connection. This tacks on an additional 30-60ms of response time. This cost comes from the MySQL server-side -- connections are internally expensive and require allocating buffers.

The network does not significantly contribute to the setup cost. Go ahead and set up a local MySQL server and take connection timings. You will still see 30ish milliseconds even over loopback! Even AWS' own connection guide for debugging MySQL packets shows the handshake taking 40ms!

AWS Mysql Slow connection time

We have two other wrinkles:

  1. Django adds some preamble queries, so that adds further to connection setup costs.
  2. We need to be able to gracefully (and quickly) recover from database failover. In practice, this means that we need to re-resolve the database hostname every time we connect. RDS DNS resolution is slow. I have the receipts! These instrumented numbers factor in cache hits.

RDS proxy connection times

All of this is to say that you want to reduce the number of times that you have to establish a MySQL connection.

The most straightforward way to do this is to reuse connections. And this actually works great up to a certain point. However, there are two quirks:

First, connections have server-side state that is expensive to maintain. A connection may take up a megabyte of ram on the database even if the connection is doing nothing. This number is highly sensitive to database configuration parameters. This cost is multiplied by thousands of connections.

Second, we have API processes and background processes that often times are doing nothing. Due to the nature of our workload, many of our services are busy and times when other services are not. In aggregate, we have a nice load pattern. But each particular service has a spiky load pattern. If we keep connections open forever, we are hogging database resources for connections that are not being used.

We have here a classic engineering tradeoff! Do we keep the connections open forever and hog database resources to ultimately minimize database connection attempts?

Short LifetimesLong Lifetimes
Least idle waste ✅Most idle waste
Frequent reconnectsMinimal reconnects ✅
Higher p95Lower p95 ✅

Database Proxies

But we want low idle waste while also having minimal reconnects and a lower p95. What do we do?

The answer is to use a database proxy. Instead of your clients connecting directly to the database server, the clients makes a "frontend connection" to the proxy. The proxy then establishes a matching "backend connection" to the real database server. Proxies (generally) talk MySQL wire protocol, so as far as your application code is concerned nothing has changed.

When your client is longer actively using the MySQL connection, the proxy will mark the backend connection as inactive. Next time a client wants to connect to the database via the proxy, the proxy will simply reuse the existing MySQL connection instead of creating a new one.

Thus, two (or more) client MySQL connections can be multiplexed onto a single real backend connection. The effect of this is that

  1. The number of connections to the MySQL database is cut down significantly, and
  2. Clients connecting to the proxy are serviced very quickly. Clients don't have to wait for the slow backend connection setup.

The first wrinkle is that if both frontend connections want to talk to the database at the same time then the proxy has to either

  1. Wait for one frontend connection to become inactive before servicing the other (introducing wait time), or
  2. Spin up another backend connection so that both frontend connections can be serviced at the same time, which makes you still pay the connection setup price as well as the backend state price.

What the proxy actually does in this case depends on the configuration.

A second wrinkle occurs due to the highly-stateful nature of MySQL connections. There is a lot of backend state for a connection. The proxy needs to know about this state as well, or is it could errantly multiplex a frontend connection onto a backend connection where the expected states are misaligned. This is a fast way to get big issues.

To solve this, proxies track the state of each frontend and backend connection. When the proxy detects that a connection has done something to affect the state that tightly bounds the frontend to the backend connection, the proxy will "pin" the frontend to the backend and prevent backend reuse.

RDS Proxy

There are a few MySQL database proxies that are big in the FOSS ecosystem right now. The top two are sqlproxy (which is relatively new), and Vitess (where the proxy ability is just small part in a much larger project). Running a proxy yourself is adding more custom infrastructure that comes with its own headaches though. A managed/vendor-hosted version is better at our scale.

And, what do you know? AWS just released RDS Proxy with support for Aurora MySQL. I tried it out and found it... wanting.

Look for my experience with RDS proxy in a post coming soon!

AWS Global Accelerator

· 4 min read
Hunter Fernandes
Software Engineer

A few months ago AWS introduced a new service called Global Accelerator.

AWS Cloudfront PoPs around the United States.

This service is designed to accept traffic at local edge locations (maybe the same Cloudfront PoPs?) and then route it over the AWS backbone to your service region. An interesting feature is that it does edge TCP termination, which can save latency on quite a few packet round trips.

Bear in mind, that after the TCP handshake, the TLS handshake is still required and that requires a round trip to the us-west-2 (Oregon) region regardless of the edge location used by Global Accelerator.

Performance Results

Of course I am a sucker for these "free" latency improvements, so I decided to give it a try and set it up on our staging environment. I asked a few coworkers around the United States to run some tests and here are the savings:

LocationTCP ShakeTLS HandshakeWeighted Savings
Hunter @ San Francisco-42 ms-1 ms-43 ms
Kevin @ Iowa-63 ms-43 ms-131 ms
Matt @ Kentucky-58 ms-27 ms-98 ms
Sajid @ Texas-50 ms+57 ms-14 ms

My own entry from San Francisco makes total sense. We see a savings on the time to set up the TCP connection because instead of having to roundtrip to Oregon, the connection can be set up in San Jose. It also makes sense that the TLS Handshake did not see any savings, as that still has to go to Oregon. The path from SF Bay Area to Oregon is pretty good, so there is not a lot of savings to be had there.

However, for Iowa and Kentucky, the savings are quite significant. This is because instead of transiting over the public internet, the traffic is now going over the AWS backbone.

Here's a traceroute from Iowa comparing the public internet to using Global Accelerator.

  • Green is with Global Accelerator.
  • Red is without Global Accelerator using the public internet.

Traceroute from Iowa

You can see that the path is much shorter and more direct with Global Accelerator. Honestly, me using Iowa as a comparison here is a bit of a cheat, as you can see from the AWS PoP / Backbone map that there is a direct line from Iowa to Oregon.

But that is kind of the point? AWS is incentivized for performance reasons to create PoPs in places with lots of people. AWS is incentivized to build our their backbone to their own PoPs. Our customers are likely to be in placed with lots of people. Therefore Global Accelerator lets us reach our customers more directly and AWS is incentivized keep building that network out.

Where it gets weird is Texas. The TCP handshake is faster, but the TLS handshake is slower. I am not sure why this is. In fact, I checked with other coworkers from different areas in Texas and they had better results.

Production

I was happy with the results and decided to roll it out to production while keeping an eye on the metrics from Texas. We rolled it out to 5% of our traffic and everything seemed to be going well, so we rolled it out to 20% then 100% of our traffic.

We observed a 17% reduction in latency across the board and a 38% reduction in the 99th percentile latency. That is an amazing improvement for a service that is just a few clicks to set up.

I am pleased to say the data from Texas has improved as well. While I am not sure what the issue was, it seems to have resolved itself. Hopefully AWS will release some better network observation tools in the future to aid debugging these issues.

Rate Limiting

· 11 min read
Hunter Fernandes
Software Engineer

Our continuous integration provider is CircleCI -- we love them! Every time an engineer merges code, several builds get kicked off. Among these is a comprehensive suite of end-to-end tests that run against a shadow cluster.

We call this shadow-cluster testing environment simply "CICD" (Continuous Integration/Continuous Deployment; we're bad at naming). Its primary purpose in life is to fail when problematic code gets released. CICD dies early so that prod doesn't later on. There are other niceties from having it, but lighting on fire before prod is one of the more valuable aspects.

A Bad Day

One day a few weeks ago, alerts started firing and our CICD site was slow. Ouch. What gives?

Datadog graph of high expensive-request rate

It seems that CircleCI was repeatedly running a test exercising an especially expensive API. Normally, we'd expect this endpoint to be called in short, small bursts. Now, however, it was being called constantly from a single IP address.

Side note: you really should not be doing a large amount of work while handling a request. Doing so exposes yourself to denial-of-service vectors.

CircleCI was very responsive and confirmed that one of their machines had entered an error state. As it turns out, the expensive job was one of the first tasks executed by a worker shard (before the task was promptly killed and run again, ad nauseam).

To immediately restore service to the rest of our engineering team, we black-holed traffic from this IP address via AWS Network Access Control List rules.

This incident, while manageable and only affecting our CICD environment, led us to consider how to block problematic requests in the future.

Requirements

We have a few interrelated goals for our rate limiting:

  1. Prevent a single entity from DOSing our API. We are explicitly not attempting to counter a coordinated malicious user with rate limiting. A sufficiently-motivated attacker could use many thousands of IP addresses. For complex attacks, we have tools like AWS WAF. It's more of a sledgehammer when we're looking for a scalpel. But when under attack, we can flip WAF on.

  2. Enforce baseline usage. Rate limiting gives us another gauge and lever of control over our client software. My firm belief about software is that, if left unchecked, it grows unruly and underpeformant naturally. It's just a fact of life. (Maybe I am showing my ops colors here).

    In order to keep the system snappy for each user, it's important to limit the calling capacity of all users and force clients to use best-practices. That means, for example, calling batch APIs instead of single-APIs individually one by one.

    Within reason, of course. We know ahead of time that in the future, we'll need to tweak limit thresholds as our product grows in features and scope. Here, limitations lead to better individual client performance. We don't want to put the cart before the horse.

  3. Minimal amount of processing for rejected requests. If we reject requests because they are over the rate limit threshold, we want to spend as few resources processing the reject as possible. It's a throw-away request, after all. Minimizing processing greatly influences where we want to enforce the rate limit in our request-response infrastructure.

  4. Rate limiting the user, not the IP address. A significant number of our customers are large health systems. We see many healthcare providers (who use our most computationally-expensive features) connecting from the same IP address. They tend to all be behind a proxy appliance such as Blue Coat "for compliance reasons."

    Side note: these insane proxies/man-in-the-middle boxes like Blue Coat are one of the reasons I don't think websites/app backends should participate in HTTP public key pinning. There are many other reasons, but this is the first that most backend folks will run into.

    We don't want to give large hospitals the same limit as we would give to a single user.

    Therefore, we want to preferentially rate limit based on authenticated user ID. But, if the client is not logged in and all we have is the IP address, then we'll have to rate limit on that. Still, we'd prefer the authenticated user ID!

Infrastructure & Where to Throttle

We considered four locations to enforce a rate limit. We strongly considered changing fundamental parts of our infrastructure to prevent malicious attacks like this in the future.

The candidates were:

  1. A Cloudfront global rate limit.
  2. An API Gateway rate limit.
  3. A Traefik plugin to implement rate limiting.
  4. Adding rate limiting as Django Middleware.

While Cloudfront offered us the chance of caching certain content (and killing two birds with one stone), we ruled it out because there are technical issues ensuring that clients cannot connect directly to our backend instead of solely through CF. The solution would involve custom header values and... it's all around very hacky.

We ruled API Gateway out because we did not want to restrict ourselves to the 10MB POST payload size limitation. We accept CCDAs and process them. They can get very large -- sometimes over a hundred MB. In the future, we'll move this to direct client-to-S3 uploads, but that is out of the scope of this post.

Traefik has a built-in rate limiting mechanism, but it only works on IP addresses and we have the requirement to throttle based on user ID if it's available. Hopefully, Traefik will add support for custom plugins soon. They've slated it for Traefik 2.

So we are left with implementing our own logic in Django Middleware. This is the worst option in one important way: the client connection has to make it all the way into our Gunicorn process before we can accept/reject the request for being over quota. Ouch.

We really want to protect the Gunicorn processes as much as possible. We can handle as many requests in parallel as we have Gunicorn processes. If a process is stuck doing rate limiting, it won't be processing another request. If many requests are coming in from a client who is spamming us, we don't want all of our Gunicorn processes dealing with those. This is an important DOS vector.

Unfortunately for us, Django Middleware is the best we're going to be able to do for now. So that's where we're going to put our code!

Algorithm for Rate Limiting

There are many, many algorithms for rate limiting. There's leaky bucket, token bucket, and sliding window, to name a few.

We want simplicity for our clients. Ideally, our clients should not have to think about rate limiting or slowing down their code to a certain point. For one-off script runs, we'd like just to accept the load. We want programming against our API to be as simple as possible for our customers. The net effect of this is that we're looking for an algorithm that gives us high burst capacity. Yes, this means the load is spikier and compressible into a narrower timeframe, but the simplicity is worth it

After considering our options, we went with the fixed-window rate limiting algorithm.

The way fixed-widow works is that you break time up into... uh... fixed windows. For us, we chose 5 minute periods. For example, a period starts at the top of the hour and ends 5 minutes into the hour.

Then, for every request that happens in that period, we increment a counter. If the counter is over our rate limit threshold, we reject the request.

A drawback of the fixed window algorithm is that the user can spend about 2x the limit. And they can spend 2x as fast as they want if they do it at the period boundary. You could offset boundaries based on user ID/IP hashes to amortize this risk... but I think it's too low to consider at this time.

Implementation

This "shared counter" idea maps nicely to our "microservices with a shared Redis cache" architecture.

Implementing the algorithm is simple! At the start of each request, we run a single command against Redis:

INCR ratelimit/{userid|ip}/2019-01-01_1220

Redis, as an entirely in-memory store, does this super fast. The network latency within an availability zone is several orders of magnitude more than the time it takes Redis to parse this statement and increment this integer. This is highly scalable and is an extremely low-cost to perform rate limiting. We can even shard on user-id/IP when it comes time to scale out.

INCR returns the now-incremented number, and our code verifies this is below the rate limit threshold. If it's above the limit, we reject the request.

There are key expiration considerations:

  • The effect of this happening in the short term to an active key for an active period would be the user getting more requests then we'd usually give them. Whatever. That's acceptable for us. We're not billing per-request. We don't need to ensure that we have a perfectly accurate count.
  • In the long term, the key will stick around indefinitely until it's evicted at Redis' leasure (when Redis needs to reclaim memory). We don't have a durability requirement and, in fact, we want it to go away after we're done with it.

So INCR by itself is a fine solution. However, you can also pipeline an EXPIREAT if you want to guarantee that the key is removed after the period has expired.

Picking a Threshold

To choose our specific rate limit threshold, we scanned a month's worth of logs. We applied different theoretically thresholds to see how many requests and users we'd affect.

We want to find a threshold where we affected a sufficiently low:

  1. Number of unique users.
  2. Number of unique user-periods.

These are different. For example, consider the following:

If we had 100 users in a month with 99 of them behaving well and sparsely calling us thrice a day while the last user constantly hammered us, we'd calculate that 1% of users affected and 97% of user-periods affected. Threshold-violating users inherently generate more user-periods than normal users.

So our guiding metric is the number of unique users affected. We'll also pay attention to the number of affected user-periods, but only as supplementary information.

We ended up choosing a threshold that affects less than 0.1% (p99.9) of users and less than 0.01% (p99.99) of user-periods. It sits at approximately three times our peak usage.

Client Visibility

While our clients should not have to fret about the rate limit, the software we write still needs to be aware that it exists. Errors happen. Our software needs to know how to handle them.

Therefore, in every API response, we return the following API headers to inform the client of their rate limiting quota usage:

  • X-Ratelimit-Limit -- The maximum number of requests that the client can perform in a period. This is customizable per user.
  • X-Ratelimit-Used -- How many requests the client has consumed.
  • X-Ratelimit-Remaining -- How many more requests the client can perform in the current period.
  • X-Ratelimit-Reset -- The time in UTC that the next period resets. Really, this is just when the next period starts.

Additionally, when we reject a request for being over the rate limiting threshold, we return HTTP 429 Too Many Requests.

This makes the error handling logic very simple:

if response.status_code == 429:
reset_time = int(response['X-Ratelimit-Reset'])
time.sleep(max(reset_time - now(), 0))
retry()

Closing Ops Work

And of course, I always include operations dials that can be turned and escape hatches that we can climb through in an emergency. We also added:

  1. The ability to modify the global threshold at runtime (or disable it entirely) without requiring a process restart. We stick global configuration into Redis for clients to periodically refresh. On the side, we update this from a more durable source of truth.

  2. We allow custom quotas per user by optionally attaching a quota claim to the user JWT. Note that this doesn't work for IP addresses. It's conceivable that we may add a secondary Redis lookup for per-IP custom quotas. We could also pipeline this operation into our initial Redis INCR and so it would add very little overhead.

  3. We continuously validate our quota threshold. We have added a stage to our logging pipeline to gather the MAX(Used) quota over periods. Our target is to ensure that the p99.9 of users are within our default quota. We compute this every day over a 30-day rolling window and pipe this into Datadog. We alert if the number is significantly different from our expectation. This prevents our actual usage of the API from drifting close to our quota limit.

Further Work

Eventually, we'd like to move this into our reverse proxy (Traefik). While Traefik does buffer the headers and body (so we are not exposed to slow client writes/reads) it would be best if our Python application does not need to handle this connection at all.

AWS Cognito Limitations

· 6 min read
Hunter Fernandes
Software Engineer

When we were initially rolling out user accounts, we decided to go with AWS Cognito. It has been incredibly frustrating to use and I need to rant about it.

tl;dr Don't use Cognito.

Cognito & JWTs

AWS released Cognito in 2014, and its goal is to serve as the authentication backend for the system you write. You integrate with Cognito by setting up a Cognito User Pool and by accepting user tokens signed by Amazon.

At a high level, the user authenticates against Cognito and receives three JSON Web Tokens that are signed by Amazon:

  1. an Access token that holds very few claims about an account. Essentially just a User ID. This is supplied to our API to prove it's you.
  2. an ID token which contains all attributes for an account. Think email, phone, name, etc.
  3. a Refresh token to get more access tokens once they expire.

When users call one of our APIs, they supply the access token in the Authorization header. It looks something like this:

GET /identity/v1/users/$me/ HTTP/1.1
Host: api.carium.com
Authorization: Bearer the-very-long-access-token-goes-here

On seeing this Authorization header, our API verifies the token is signed (correctly) by Amazon and that the token is not expired among other things. If the signatures match and other criteria are met, then we know that you are you and we can give you privileged access to your account!

But access tokens only last for an hour. We don't want the user to have to log in every hour. They continue to use the authentication after an hour by using the refresh token to acquire another access token. This is done via a Cognito API. Therefore, the client will be refreshing the access token every hour for the duration of the session. (If the client misses a refresh period that's fine. There is no continued-refresh requirement).

That is the gist of JWTs. Now, back to Cognito.

The Good

Why did we go with Cognito in the first place?

  1. It's not our core competency. Using Cognito allows us to offload complex identity management to a team of experts that live and breathe identity. And because it's their core focus, you get cool things like...

  2. Secure Remote Password (SRP) protocol. Instead of us offloading password-derivatives onto AWS, with SRP even AWS doesn't know the password! With SRP, the actual password is never transferred to a remote server. That is super cool.

  3. Handles registration for us. Cognito will take care of verifying email addresses and even phone numbers so that you don't need to implement that flow.

The Bad

Now that I've listed all the reasons we started going with Cognito, here are all the pain points we've felt along the way. Some of them are very painful.

  1. No custom JWT fields. Cognito does not allow you to store custom fields on the access tokens. We have some information that we really want to stick on the stateless tokens.

  2. Cognito doesn't let us issue tokens for a user without their password. I will be the first to admit that this is really nice from a security perspective. But we are a healthcare app and we need to be able to help our users when they are in technical trouble.

    One of the most powerful tools we can give to our support staff is impersonating patients to see the issue they are seeing. We can't do that without either a) issuing tokens for the user or by b) adding a custom field on JWTs (along with some logic in our apps to recognize this new fields). But neither is possible in Cognito!

  3. There is no easy email templates differentiation between events like verify email and forgot password. You have to give them just a single giant email template file and have a bunch of crazy if-else blocks in it to render parts differently based on event parameters. This should be a lot easier.

  4. No multipart email support. That means your emails (for sign up, resetting a password, etc) can either be plaintext or html, but not both. If you want to include links in your mail then simple email clients won't be able to render your message at all (they would normally render the plaintext version).

  5. cognito:GetUser has a permanently-low rate limit. That's right, the only API that will give you all user attributes (as well as verifying the token) can't be called that often. And it's a hard limit, too. It does not scale up as the number of users in your pool increases (confirmed with AWS Support).

    What this means is that you have to build your own storage to mirror the attributes in the pool. If you have to do that, then why are you using Cognito at all?

  6. Cognito does not allow passwords with spaces. Yes, really. That means the old "correct horse battery staple" advice is not allowed. That is insane. And further than that, it's an insane requirement that we need to justify to our customers. We are not a bank from the 90s but that's the first impression our users get of us.

    banned correct horse battery staple.

  7. No SAML integration. As a business that interfaces with large health systems, we will need to support SAML at some point in the future. Cognito does not support this at all.

  8. And the biggest one of all: no ability to backup a user pool. If you accidentally delete your user pool or errant code goes rogue, then your business is over. You don't get to take backups. That's it. Done. You can't even move users from one pool to another (I expect this has something to do with SRP keys).

    As a workaround, you can collect all attributes of your users and store that list somewhere as a crap backup. But you can't automatically create restored users in a new pool (they need to verify their email first). Furthermore, your list would still require users to reset their password because Cognito cannot give you a hash (or, instead, their secret half of the SRP).

    All of the other problems with Cognito make me annoyed, but an inability to backup my user list legitimately terrifies me.

The Ugly

So due to Cognito limitations, we will have to implement our own user store and authentication service.

I think we ultimately failed because we tried to bend Cognito to fit our needs and Cognito is not designed for that. Cognito demands that your app bend to Cognito's auth flows. That's fine for mobile app du jour, but it just doesn't work for the enterprise software half of our business.

Writing an authentication backend is hard, the risks are high, and the user migration will be long.

Oh well.