This is a follow-up to my previous blog post, SQS Slow Tail Performance. That post has much more detail about the problem. For various work-related reasons, I am finally revisiting SQS performance. It's my white whale, and I think about it frequently. And I've discovered at least one thing!
In my previous post, I mentioned both that HTTP "cold-start" times and low HTTP Connection: keep-alive times could be a contributing factor. And, after some more investigating, it turns out I was sort of right. Sort of.
HTTP Keep-Alive is when the server indicates to the client that the TCP connection should be kept open after the HTTP Response is sent back. Normally (under HTTP/1), the TCP connection would be closed after the response is completed. Keeping it alive lowers the TCP/TLS overhead associated with making a request. When using keep-alive, you only pay the overhead for the first request and all subsequent requests get to piggyback on the connection.
Persistent connections are so performance-enhancing that the HTTP/1.1 specification makes them the default (§8.1.2.1)! The method by which the server indicates to the client that it wants to close the connection is by sending Connection: close. But the server can just close the connection anyways without warning.
I ran some more tests like last time. Importantly, the difference from the testing I did in my previous post was that I executed more sqs:SendMessage calls serially. Last time I did 20. This time I did 180. It turns out that the magic number is... 🥁🥁🥁 80!
Every 80 messages, we see a definite spike in request time! To be fair, we don't only see a latency spike on the 81st message, but we always see it every 80.
And what do you know? 1-1/80 = 98.75. This is where our definite 99th percentile latency comes from! So what the heck is happening every 80 messages?
To test sqs:SendMessage latency, I set up an EC2 instance in order to run calls from within a VPC. This should minimize network factors. Typically, we see intra-vpc packet latency of about 40 microseconds (the best of the three largest cloud providers; study courtesy of Cockroach Labs). So any latency we see in our calls to SQS can reasonably be attributed to just SQS and not the network between my test server and SQS servers.
Here are the test parameters:
Queue encryption enabled with the default AWS-provided key.
The data key reuse period for encryption was 30 minutes.
Message expiration of 5 minutes. We'll never consume any messages and instead, choose to let them expire.
Visibility timeout of 30 seconds. This should not affect anything as we are not consuming messages.
Message Payload of 1 kB of random bytes. Random so that it's not compressible.
Concurrent runs capped to 16.
I ran 100 runs, each consisting of 180 serial sends each and then aggregated the results. Here are the results, plotting the p75 latency across all the calls at a given position:
Notice that every 80 messages we see a big bump in the p75 latency? We have high call times on the 1st, 81st, and 161st messages. Very suspicious!
The AWS client library I use is boto3, which also returns response headers. As it turns out, SQS is explicitly sending Connection: close to us after 80 messages being sent on a connection. SQS is deliberately closing the connection! You'll typically see this behavior in distributed systems to prevent too much load from going to one node.
However, we don't just see slow calls every 80 sends. We see slow calls all over the place, just less frequently. Here is the max() call time from each position.
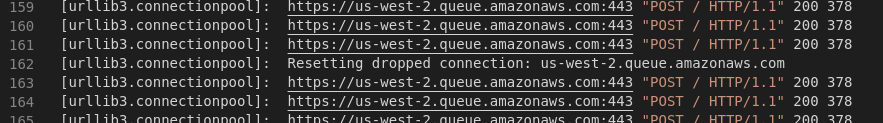
This seems like evidence that the connections are being dropped even before the 80th message. Boto3 uses the urllib2 under the hood, and urllib comes with excellent logging. Let's turn it on and see what's going on!
And, after executing a single serial run we see connection resets exactly where we'd expect them.
Unfortunately, we don't also see "silently dropped connections" (aka, TCP connections closed without a Connection: close header). urllib2 is indicating that some of the non-80 slowness is still being sent over an established connection. The mystery continues...
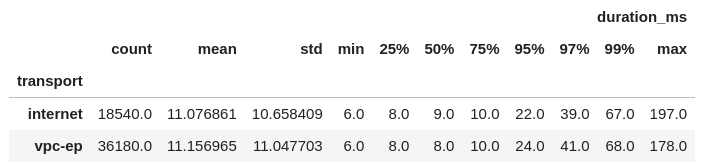
There was some question what kind of performance impact VPC Endpoints would have. So I set one up for SQS in my test VPC and the results were... meh. Here's a histogram of call times and some summary statistics:
Completely meh. The VPC Endpoints runs are actually worse at the tail. You'd think that eliminating any extra network hops through an Endpoint would reduce that, but 🤷.
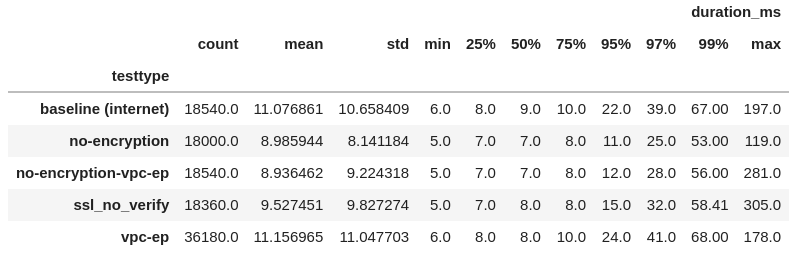
Here are all the test parameters I checked. You can see that the 99% remains pretty high.
I think this is the end of the line for SQS performance. We've made sure that everything between us and SQS is removed and yet we're still seeing random spikes of latency that can't be explained by connection reuse.
At my company, we use AWS Simple Queue Service (SQS)
for a lot of heavy lifting. We send ✨many✨ messages. I can say that
it's into the millions per day. Because we call SQS so frequently and instrument everything, we get
to see its varied performance under different conditions.
Our application backend is written in Python using Django and Gunicorn and uses the pre-fork model.1
This means that we always need to have a Gunicorn process available and waiting to pick up a connection
when it comes in. If no Gunicorn process is available to receive the connection, it just sits and hangs.
This means that we need to optimize on keeping Gunicorn processes free. One of the main ways to do this
is to minimize the amount of work a process must perform in order to satisfy any single API request.
But that work still needs to be done, after all.
So we have a bunch of separate workers waiting to receive tasks in the background.
These background workers process work that takes a long time to complete.
We offload all long work from our Gunicorn workers to our background workers.
But how do you get the work from your frontend Guncicorn processes to your background worker pool?
The answer is by using a message queue. Your frontend writes ("produces") jobs to the message queue.
The message queue saves it (so you don't lose work) and then manages the process of routing it to a background worker (the "consumers"). The message queue we use is SQS. We use the wonderful
celery project to manage the producer/consumer interface. But the performance characteristics all come from SQS.
To recap, if a Gunicorn API process needs to do any non-negligible amount of work when
handling a web request, it will create a
task to run in the background and send it to SQS
through the sqs:SendMessage AWS API.
The net effect is that the long work has been moved off the critical path and into the background.
The only work remaining on the critical path is the act of sending the task to the message queue.
So as long as you keep the task-send times low, everything is great. The problem is that sometimes
the task-send times are high. You pay the price for this on the critical path.
We care a lot about our API response time: high response times lead to
worse user experiences. Nobody wants to click a button in an app and get
three seconds of spinners before anything happens. That sucks. It's bad U/X.
One of the most valuable measures of performance in the real world is tail latency.
You might think of it as
how your app has performed in the worst cases. You line up all your response
times (fastest-to-slowest) and look at the worst offenders. This is very hard
to visualize, so we apply one more transformation: we make a histogram.
We make response time buckets and count
each response time in the bucket. Now we've formed a latency distribution diagram.
Quick note for the uninitiated: pX are percentiles. Roughly, this means that pX is the Xth slowest
time out of 100 samples. For example, p95 is the 95th slowest. It scales, too:
p99.99 is the 9,999th slowest out of 10,000 samples.
If you're more in the world of statistics, you'll often see it written with
subscript such as p95.
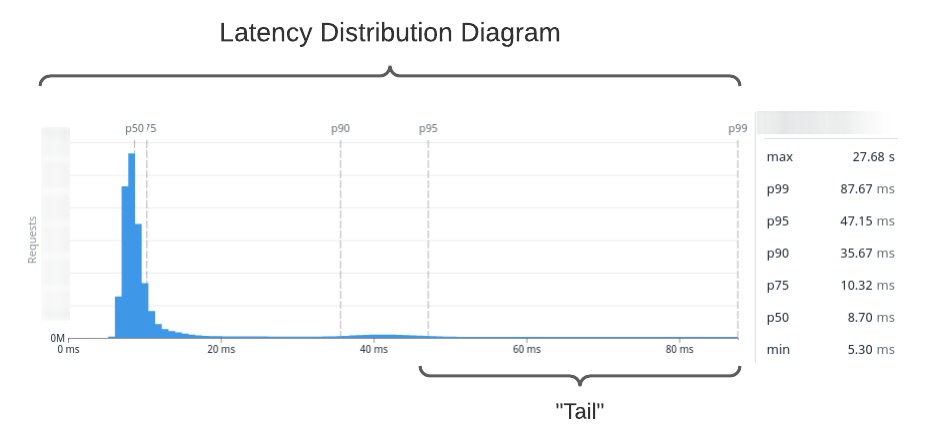
You can use your latency distribution diagram to understand at a glance how your application
performs. Here's our sqs:SendMessage latency distribution sampled over the past month.
I've labeled the high-end of the distribution, which we call the tail.
We have a backend-wide
meeting twice a month where we go over each endpoint's performance. We generally
aim for responses in less than 100 milliseconds. Some APIs are inherently more expensive,
they will take longer, and that's ok. But the general target is 100ms.
One of the most useful tools for figuring out what's going on during a request is
(distributed) tracing! You may have heard of this under an older and more vague name: "application
performance monitoring" (APM). Our vendor of choice for this is
Datadog, who provides an excellent
tracing product.
For the last several performance meetings, we've had the same problem crop up. We look at the slowest
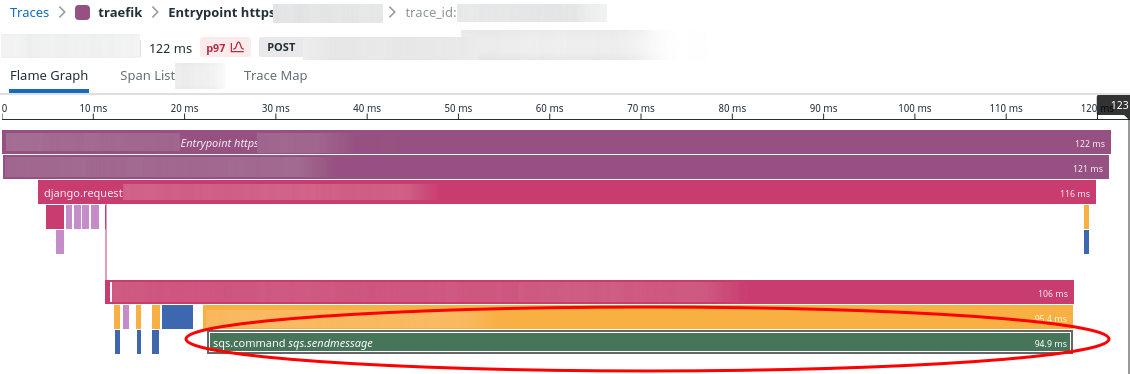
1-3% of calls for a given API endpoint and they always look the same. Here's a representative sample:
See the big green bar at the bottom? That is all sqs:SendMessage. Of the request's 122ms response time, 95ms or
75% of the total time was waiting for SQS:SendMessage. This specific sample was the p97 for this
API endpoint.
There are two insights we get from this trace:
To improve the performance of this endpoint, we need to focus on SQS. Nothing else really matters.
High tail latency for any of our service dependencies are going to directly drive our API performance at the tail.
Of course, this makes total sense. But it's good to acknowledge it explicitly!
It's futile to try to squeeze better performance out of your own service if a dependency
has poor tail latency.
The only way to improve the tail latency is to either drop the poor performer
or to change the semantics of your endpoint. A third option is to attempt to alleviate the tail latencies
for your service dependency if you can do so. You can do
this if you own the service! But sometimes, all you have is a black box owned by a third party (like SQS).
An example of changing API semantics: instead of performing the blocking SendMessage operation
on the main API handler thread, you might spin the call out to its own dedicated thread. Then, you might check
on the send status before the API request finishes.
The semantic "twist" happens when you consider what
happens in the case of a 5, 10, or even 20 second SendMessage call time. What does the API thread do when
it's done handling the API request but the SendMessage operation still hasn't yet been completed?
Do you just... skip waiting for the send to complete and move
on? If so, your semantics have changed: you can no longer guarantee that you durably saved the task.
Your task may never get run because it never got sent.
For some exceedingly rare endpoints, that's acceptable behavior. For most, it's not.
There is yet another point hidden in my example. Instead of just not caring whether the task was sent,
say instead we block the API response until the task send completes (off thread).
Basically, we get the amount of time we spend doing other non-SQS things shaved
off of the SQS time. But we still have to pay for everything over the other useful time.
In this case, we've only improved perhaps the p80-p95 of our endpoint.
But the worst-case p95+ will still stay the same! If our goal in making that change was to reduce the
p95+ latency then we would have failed.
SQS has a few knobs we can turn to see if they help with latency. Really, these knobs are other SQS features,
but perhaps we can find some correlation to what causes latency spikes and
work around them. Furthermore, we can use our knowledge of
the transport stack to make a few educated guesses.
Since SQS is a black box to us, this is very much spooky action at a distance.
How about initiating new connections to the SQS service before keep-alive kicks in on boto3. If our process has never
talked to SQS before, it stands to reason that there is some initial cost in establishing a connection to it in
terms of TCP setup, TLS handshaking, and perhaps some IAM controls on AWS' side.
To test this, we ran a test that cold-started an SQS connection, sent the first message, and then sent several
messages afterwards when keep-alive was active. Indeed, we found that
the p95 of the first SendMessage was 87ms and the p95 of the following 19 calls was 6ms.
It sure seems like cold-starts are the issue. Keep-alive should fix this issue.
A confounding variable is that sometimes we see slow SendMessage calls even in the next 20 operations following an
initial message. If the slow call was just the first call, we could probably work around it. But it's not
just the first one.
In boto, you can set the maximum amount of time that urllib will keep a connection around
without closing it. It should really only affect idle connections, however.
We cranked this up to 1 hour and there was no effect on send times.
Our queues are encrypted with AWS KMS keys. Perhaps this adds jitter?
Our testing found KMS queue encryption does not have an effect on SendMessage calls.
It did not matter if the data key reuse period was 1 minute or 12 hours.
Enabling encryption
increased the p95 of SendMessage by 6ms. From 12ms without encryption to 18ms with encryption.
That's pretty far away from the magic number of 100ms we are looking for.
Perhaps some infrastructure process happening behind the scenes when we scale up/down and send more (or fewer)
messages throughout the day. If so, we might see performance degradation when we are transitioning
along the edges of the scaling step function. Perhaps SQS is rebalancing partitions in the background.
If this were to be the case, then we would see high latency spikes sporadically
during certain periods throughout the day.
We'd see slow calls happen in bursts. I could not find any evidence of this from our metrics.
Instead, the slow calls are spread out throughout the day. No spikes.
Frankly, I consider this answer kind of a cop-out from AWS. For being a critical service to many
projects, the published performance numbers are too vague. I had a brief foray into hardware
last year. One of the best aspects of the hardware
space is that every component has a very detailed spec sheet. You get characteristic curves for all kinds
of conditions. In software, it's just a crapshoot. Services aiming to underpin your own service
should be publishing spec sheets.
Normally, finding out the designed performance characteristics are suboptimal would be the end of the road.
We'd start looking at other message queues. But we are tied to SQS right now.
We know that the p90 for SendMessage is 40ms so we know latencies lower than 100ms are possible.
We don't have a great solution to increase SQS performance. Our best lead is
cold-start connection times. But we have tweaked all the configuration that
is available to us and we still do not see improved tail latency.
If we want to improve our endpoint tail latency, we'll probably have to replace SQS
with another message queue.
Our Django application connects to MySQL to store all of its data. This is a pretty typical setup. However, you may not know that establishing connections to MySQL is rather expensive.
I have written previously about controlling API response times -- we take it very seriously! One thing that blows up response latencies at higher percentiles is when our application has to establish a new MySQL connection. This tacks on an additional 30-60ms of response time. This cost comes from the MySQL server-side -- connections are internally expensive and require allocating buffers.
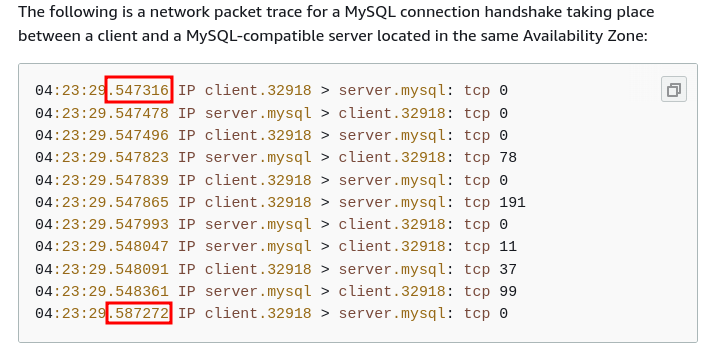
The network does not significantly contribute to the setup cost. Go ahead and set up a local MySQL server and take connection timings. You will still see 30ish milliseconds even over loopback! Even AWS' own connection guide for debugging MySQL packets shows the handshake taking 40ms!
We have two other wrinkles:
Django adds some preamble queries, so that adds further to connection setup costs.
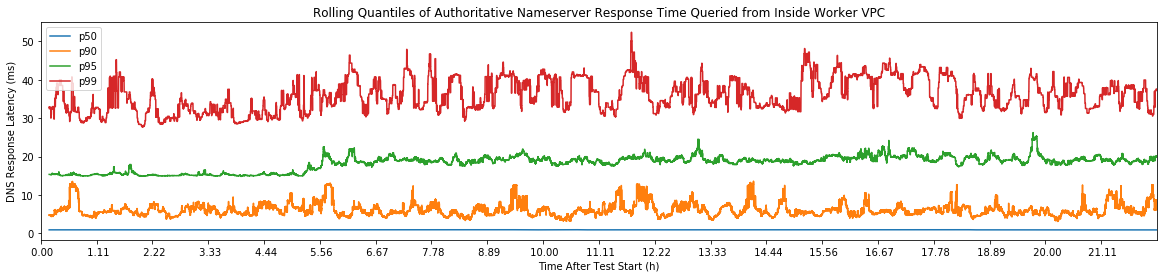
We need to be able to gracefully (and quickly) recover from database failover. In practice, this means that we need to re-resolve the database hostname every time we connect. RDS DNS resolution is slow. I have the receipts! These instrumented numbers factor in cache hits.
All of this is to say that you want to reduce the number of times that you have to establish a MySQL connection.
The most straightforward way to do this is to reuse connections. And this actually works great up to a certain point. However, there are two quirks:
First, connections have server-side state that is expensive to maintain. A connection may take up a megabyte of ram on the database even if the connection is doing nothing. This number is highly sensitive to database configuration parameters. This cost is multiplied by thousands of connections.
Second, we have API processes and background processes that often times are doing nothing. Due to the nature of our workload, many of our services are busy and times when other services are not. In aggregate, we have a nice load pattern. But each particular service has a spiky load pattern. If we keep connections open forever, we are hogging database resources for connections that are not being used.
We have here a classic engineering tradeoff! Do we keep the connections open forever and hog database resources to ultimately minimize database connection attempts?
But we want low idle waste while also having minimal reconnects and a lower p95. What do we do?
The answer is to use a database proxy. Instead of your clients connecting directly to the database server, the clients makes a "frontend connection" to the proxy. The proxy then establishes a matching "backend connection" to the real database server. Proxies (generally) talk MySQL wire protocol, so as far as your application code is concerned nothing has changed.
When your client is longer actively using the MySQL connection, the proxy will mark the backend connection as inactive. Next time a client wants to connect to the database via the proxy, the proxy will simply reuse the existing MySQL connection instead of creating a new one.
Thus, two (or more) client MySQL connections can be multiplexed onto a single real backend connection. The effect of this is that
The number of connections to the MySQL database is cut down significantly, and
Clients connecting to the proxy are serviced very quickly. Clients don't have to wait for the slow backend connection setup.
The first wrinkle is that if both frontend connections want to talk to the database at the same time then the proxy has to either
Wait for one frontend connection to become inactive before servicing the other (introducing wait time), or
Spin up another backend connection so that both frontend connections can be serviced at the same time, which makes you still pay the connection setup price as well as the backend state price.
What the proxy actually does in this case depends on the configuration.
A second wrinkle occurs due to the highly-stateful nature of MySQL connections. There is a lot of backend state for a connection. The proxy needs to know about this state as well, or is it could errantly multiplex a frontend connection onto a backend connection where the expected states are misaligned. This is a fast way to get big issues.
To solve this, proxies track the state of each frontend and backend connection. When the proxy detects that a connection has done something to affect the state that tightly bounds the frontend to the backend connection, the proxy will "pin" the frontend to the backend and prevent backend reuse.
There are a few MySQL database proxies that are big in the FOSS ecosystem right now. The top two are sqlproxy (which is relatively new),
and Vitess (where the proxy ability is just small part in a much larger project). Running a proxy yourself is adding more custom infrastructure that
comes with its own headaches though. A managed/vendor-hosted version is better at our scale.
And, what do you know? AWS just released RDS Proxy with support for Aurora MySQL. I tried it out and found it... wanting.
Look for my experience with RDS proxy in a post coming soon!

-f21ebb7a387e4abe81a9b92aba76a8ed.png)
-5111147b6c1dc040d8ef97a2366a70df.png)
-7cd5d20668ae8d5a47e657200d89ab0f.png)